This article highlights the importance of construction stages in studying frame structures with transfer beams. For this purpose, a result comparison between Advance Design construction stages and classical full model single run analysis are presented for a steel frame model with a transfer beam.
Keywords: Advance Design, Construction Stages, Transfer Beam.
1. Introduction
In conventional structural analysis, all loadings are applied at once on the complete final structure before studying their effects in a single step calculation. In other words, no loading of any type is applied on the structure until the entire construction process is completed. However, in practice, structures are constructed in stages (story by story) and loadings such as self-weight, construction and finishing loads are present at each stage prior to structure completion. Therefore, at each construction stage, the distribution of displacements and internal forces in the completed parts of the structure (due to the existing loads) is not affected by elements of upper stories that do not exist yet.
Neglecting the construction stages effect in the classical analysis will sometimes yield wrong results. A good example where this effect should not be overlooked is in analyzing frame structures with transfer beams.
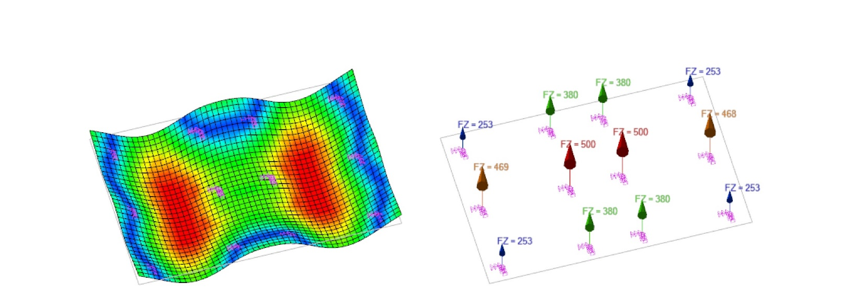
2.Frame structure with transfer beam
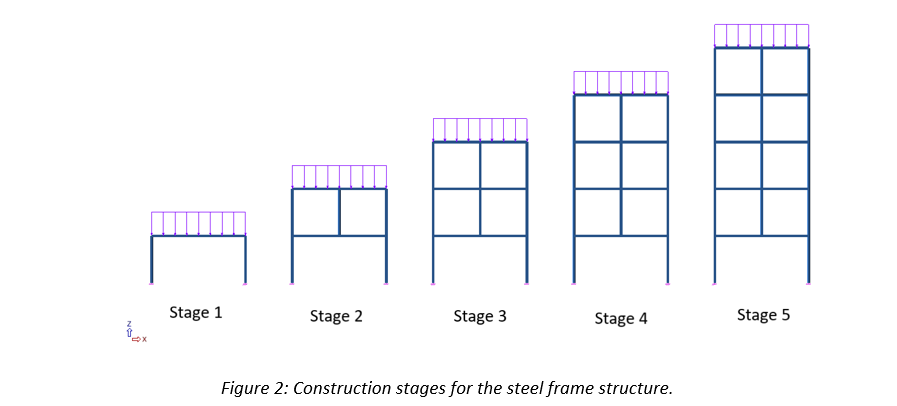
A steel frame structure with a transfer beam in story 1 is considered. This structure is subjected to its self-weight and finishing dead loads at each story (refer to Figure 1).
2.1. Construction stages
Construction stages are defined according to the actual story by story construction sequence (Refer to Figure 2).
2.2. Results comparison
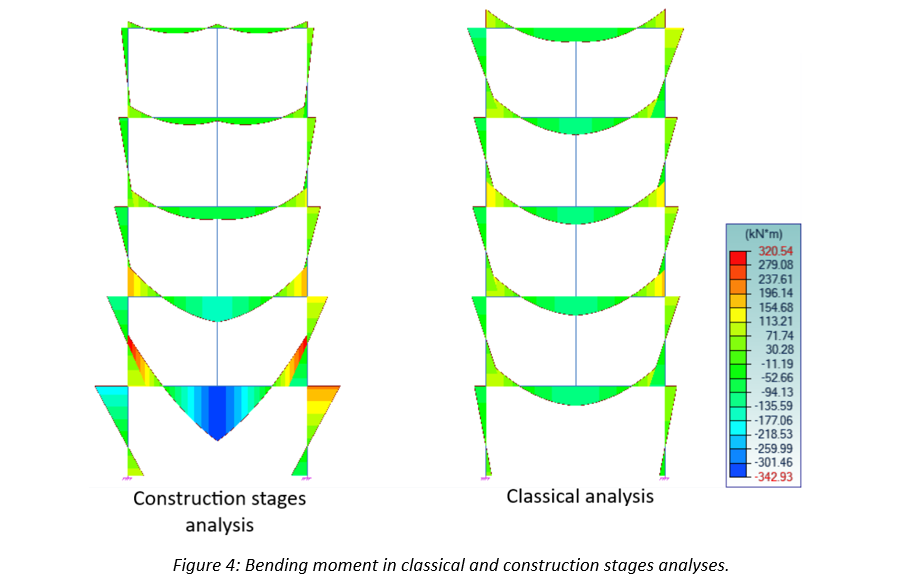
To highlight the importance of conducting construction stages analysis, results comparison between the Advance Design classical analysis (all loads applied at once on the complete final structure) and construction stages will be presented (refer to Figures 3, 4 and 5).
3. Conclusion
The real structural behavior obtained by the construction stages analysis is very different from the results of the classical analysis. Neglecting the construction stages effect, will lead to a dangerous under dimensioning of the transfer beam and middle column.
In this article you will see how to define a support of limited capacity for example a foundation piles.
Keywords: #AdvanceDesign #Concrete #Piles #FEM
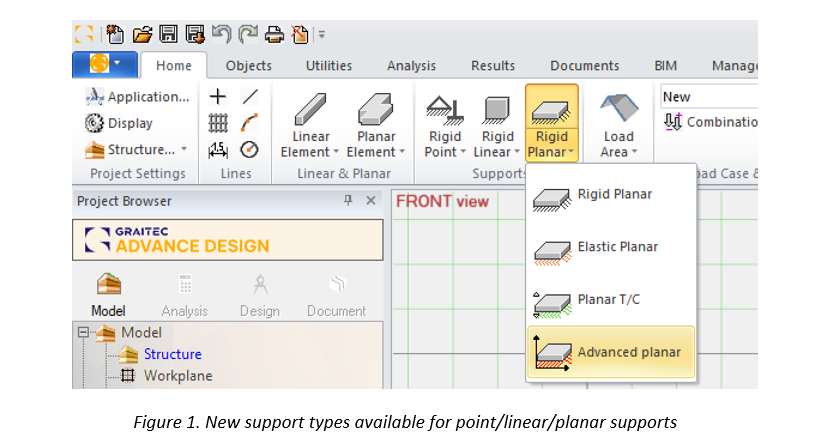
1. New advanced support in Advance Design 2023
In Advance Design you could easily define rigid, elastic and non-linear (tension/compression) supports. Starting with 2023 release of Advance Design the possibilities increase with new more advanced support type. This new type will allow you to define more complex non-linear functions.
The definition of new supports is as it was before. However the restraints are specified differently.
Right now for each direction a different function can be defined. There are 3 linear restraints (free, fixed or elastic) and 5 non-linear where user specify a specific function.
2. Support with limited capacity
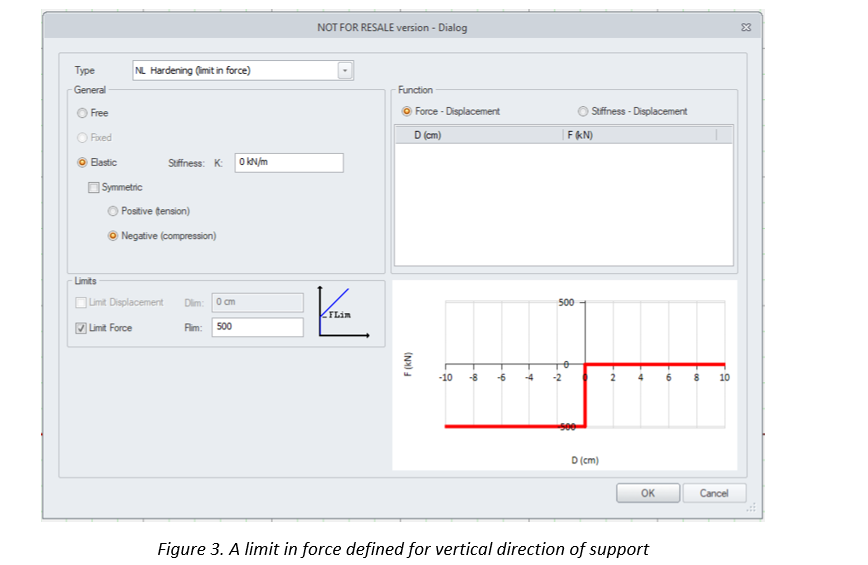
One of the example of non-linear support type is ‘Hardening’. For this support user specify a limit in force after which supports reaches it capacity.
Above you can see a support that is rigid until reaching the limit in force of 500kN. After reaching it capacity the support weakens and has reduced stiffness – its not rigid anymore. The restraint become free or elastic if any stiffness is defined.
Please see this simple example below of a foundation slab supported by piles of capacity 500kN.
When external loads are of low value piles do not reach the capacity limit. All works with the same rigidity.
But with increasing the loads some of supports reach the limit. Deformation changes because 2 middle piles can’t take any more load. The forces are distributed to neighboring supports.
With further increasing of loads more and more piles reach 500kN support force, until point of the slab being unstable.
3. Summary
As you can see this new support type will allow you to perform more advanced and complex analysis, and cover a bigger spectrum of design needs.
Note that limit in force is only one of the possibilities. Thanks to non-linear diagram definition user can reflect any behavior of structure support.
In Advance Design, we can quickly and efficiently perform the entire design process of a building structure, from modelling to analysis and structural optimization. And an integral part of the design process is the review, evaluation, and documentation of the calculation results. Today we will look at one aspect of this – methods for viewing results from FEM calculations using values in tables.
Available methods of presenting results with using tables
Results in tabular form can be generated in two ways – by generating tables during report generation, or using a new mechanism introduced in the latest 2023 version, by generating tables with results directly on the screen. Let’s look at the two methods in turn.
Report tables
One of the main components of calculation reports are tables with results. The selection of the template tables that are to be included in the report is made on the Table tab of the report generator. In case of FEM analysis results, the number and type of available table templates depends on the model, including the type of calculations performed. For example, if no surface elements have been defined in the model, then no templates with results tables for surface elements will be found in the list
However, before we start to generate a report with a table, especially in case of results from FEA results, it is crucial to properly narrow down the range of results to be viewed. The reason is very simple – the number of results can be huge, especially when we have a larger model and a large number of combinations. In addition, most tables, such as the internal forces table for linear elements, present results at each node by default. With a relatively dense division into finite elements, this can result in a table that is many pages long for a single beam. So how do I filter the report tables?
Let’s start by selecting load cases / combinations. This can be done directly in the generator window using the load cases / combinations filter window. Thanks to the convenient selection options, we can easily set the range of interest. The selection made in this way is common for all tables for which you are generating the report.
However, if you want to select a different case range for some tables, then you can filter using the properties dialog box for each such table.
This way is also used for selecting points in which the results are presented. We can increase or decrease the result point density by selecting one of the options from the list. For example, in the table of internal forces of linear elements, by default the results are displayed in nodes of finite elements. We can change this setting so that the results are presented at 3 points – at the beginning, middle and end of the member, for example.
To have the table contain results for only selected objects, we can also use the table properties dialog box to generate a table for only the items in the selected systems. But we can also easily generate a table for any range of objects, even for a single element. To do so, before generating a table, you should simply select the elements for which you want to generate a report.
Another important functionality is the ability to create your own table templates. It means that we can decide what information and results should be placed in particular rows and columns of the table. We can put different types of data and results in the same table, of course within the same element type (for example, a linear element). Such templates can then be used to generate tables in exactly the same way as the default templates.
Tables with results
In Advance Design 2023, we have the ability to filter and check FEM calculation results even faster. This is all thanks to the new “Results Tables” functionality which allows us to quickly display the results in tabular form directly on the screen. This feature is available after the FE calculation has been completed and can be accessed directly from the ribbon.
We can generate tables using default template list, and if we want to narrow the number of displayed columns, we can easily hide the unnecessary.
But we can also create our own template with specific result columns and settings. For this purpose, a similar mechanism and dialog box is used as when defining report table templates. Saved table templates will be able to be used in all projects or deleted when no longer needed.
Similar to the report tables, you can narrow the table content to show results for only selected objects as well as for only selected load cases/combinations.
The tables also have useful features that make it easier to find interesting results in the already generated table. For example in an easy way we can sort values on columns, just by double clicking on headers. And we can filter the results using special fields below column headers. We can use text filters but also different types of single and multiple value ranges. And what is great is that we can easily use multiple filters at the same time.
Finally, another great feature of the tables is the ability to export of the contents of the table to an Excel spreadsheet. To do this, just use the export button and the whole process will run automatically. This allows us different scenarios for further external work with results.