Pushover analysis consists of 3 major phases, first the preprocessing phase in which the model is prepared for the analysis. Then, the processing phase during which the model is analyzed and finally the post processing phase where the results are interpreted.
1. Preprocessing phase:
the user first needs to define the plastic hinges at locations where they are expected to occur (ends of beams), or at locations where their arise needs to be monitored (ends of columns). The plastic hinges can be defined on individual linear elements from the properties panel.
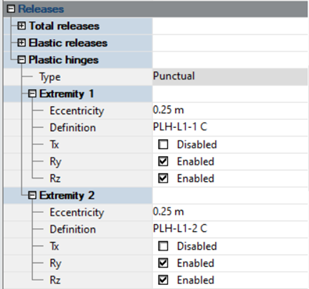
Separately for each extremity, the user is able to select the degrees of freedom for which the hinge is applicable. The ID name of a plastic hinge is generated automatically, and it consists of prefix PLH-L (plastic hinge on linear element), ID of the element, the extremity (1 or 2) and the type of the element (B – for beams, C for columns). The definition of parameters of the plastic hinge can be done by using a dialog opened by a button on the Definition property.
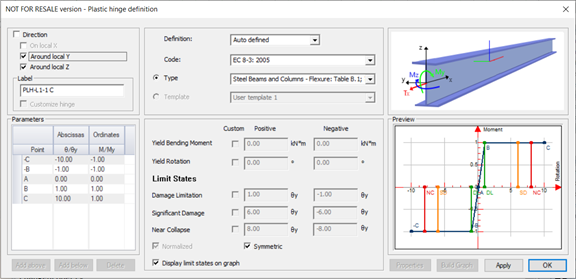
In a case the user decides that hinge parameters are calculated automatically, he can select the code (EC 8-3 or FEMA 356) and element type. The list of types (steel or concrete beams and columns) depending on the selected code. The content of the part with properties also depends on the selected code. Note, that some of parameters are computed during the next stage, during the pushover analysis. In case the user decides to manually define hinge parameters, then after selecting the code can unlock and edit available parameters.
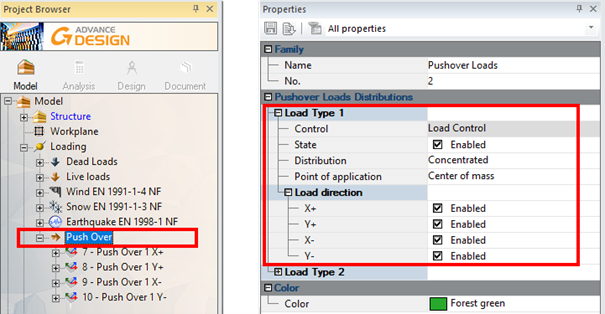
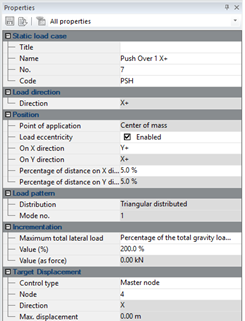
The next step is the creation of pushover load cases and generation of pushover loads. For this, a Pushover load case family type can be defined from the Create load case family. On its property list we can set the basic data for load generation such as: the distribution type, the point of application and the directions of the loads.
There are several load patterns available to distribute the pushover forces on the height of the structure:
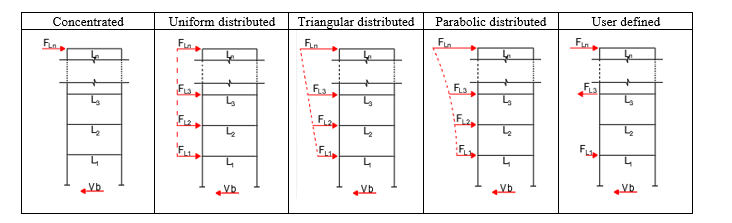
Where Vb is the maximum total lateral load and Fn is the maximum lateral load applied on level n.
Using the right click menu on the PushOver load case family we can then automatically generate the pushover load cases and loads. On the property list of each generated pushover load case we can set details related to the maximum total lateral load and conditions for stopping the analysis.
The maximum total lateral load is the cumulated sum of the lateral loads applied on last step of the pushover analysis. This load can be defined either as the imposed value or as a percentage of the load applied on the structure prior to the pushover. For the second case we can use either the total gravity loads or the seismic base shear force on X or Y direction.
2. Processing phase:
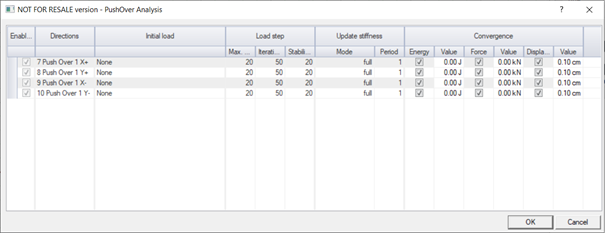
The pushover analysis is a list of sequential actions, activated by a dedicated Pushover checkbox control in Calculation Sequence dialog

The pushover analysis is a static nonlinear analysis during which the structure will be pushed laterally until reaching the maximum specified lateral force or developing a failure mechanism.
3. Postprocessing phase:
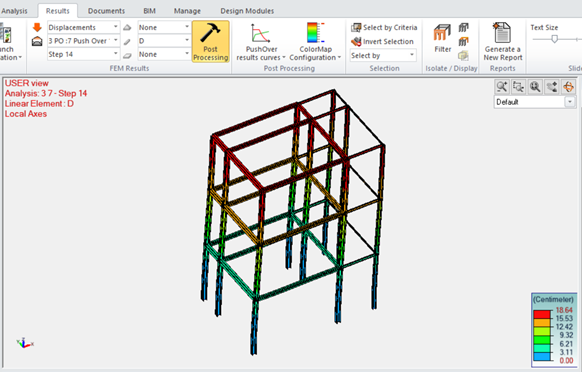
As with normal static calculations, FEM results such as displacements and internal forces are available. The results can be checked as for the non-linear calculations for each of the subsequent calculation steps.
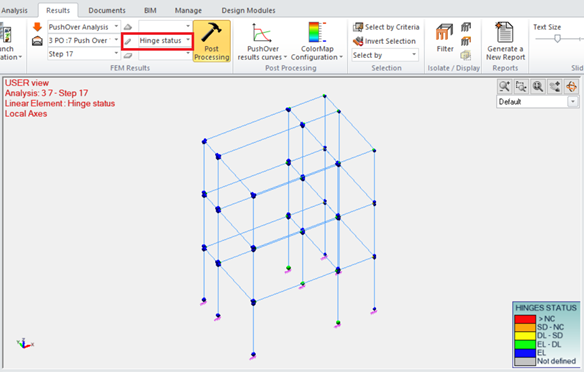
A Pushover Results entry is available on the FEM results selection that allows for selecting the Hinge status result for linear elements. When activated, it shows status of defined plastic hinges for selected step of the selected pushover case. The status is displayed by using colors.
Using the Pushover results curves command, available on the Results ribbon, a pushover capacity curve can be generated. It displays a relationship diagram of the displacement of control node with respect to the total applied lateral load.
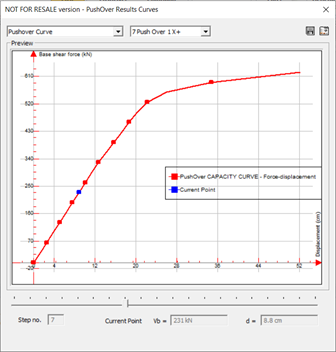
The pushover capacity curve represents the structural capacity to resist lateral loading and is a reflection on how the structure will behave when loaded laterally (seismic loads). During earthquake, the structure will be pushed laterally until a certain maximum displacement of its control node (master node). The point on the pushover capacity curve having this maximum seismic displacement is called the performance point. Physically speaking, this performance point is the balance point between the structural capacity (pushover capacity curve) and the seismic demand (seismic response spectrum). Advance Design can calculate the performance point according to the Eurocode 8 N2 method and ATC 40 Capacity Spectrum Method.
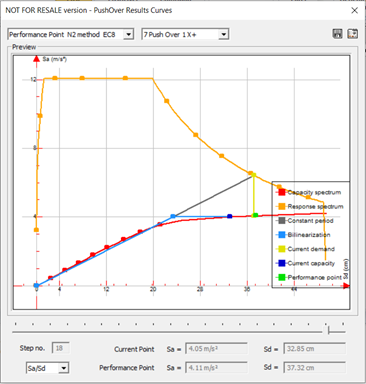
Knowing the maximum lateral displacement provided by the performance point, the user can refer to the pushover step corresponding to this maximum displacement and check the locations and limit states of plastic hinges, inter story drifts …
