Structural Analysis Product Line Manager
Abstract
In this article, you will learn about the possibilities of Advance Design for the graphical presentation of results for surface elements.
Keywords: Advance Design, Finite Elements, FEM, Floors, Slabs, Walls
Graphical presentation of results for surface elements
Advance Design can generate and calculate various types of three-dimensional structures, including those containing flat surface elements (such as slabs or walls), as well as shell elements (e.g. curved roofs or circular tanks). In addition to the preparation of the model and the execution of the calculations, an integral part of the design process is the review, evaluation, and documentation of the calculation results. Today we will look at one aspect of this – the ways in which results for surface elements are presented graphically in Advance Design.
Model
The available methods will be presented on the example of one slab of a very simple spatial model of a concrete structure.
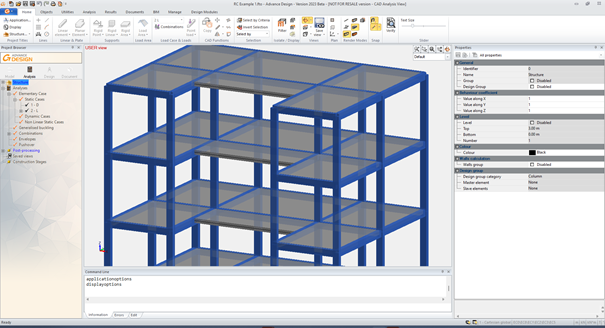
For the selected load case, we will check the graphical presentation of the displacement results, but the same methods as presented below can be used to display other types of results, ranging from internal forces and stresses to outputs related to the design of reinforcement (for example reinforcement areas or crack values).
How to change display settings for results
With the model calculated, displacements for all or selected part of the model can be displayed directly using the commands available on the ribbon. The results are then presented using a default display mode – in the case of displacements this is called ‘Deformed’. To change the mode, use the window with the setting of graphic results (opened, for example, using the keyboard shortcut Alt+Z). Note that the list of available display modes depends on the type of element and the type of result. In the case of surface elements, a list as shown in the image below will be available.
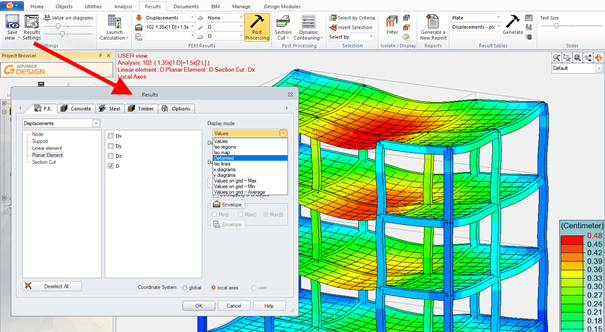
Available display modes
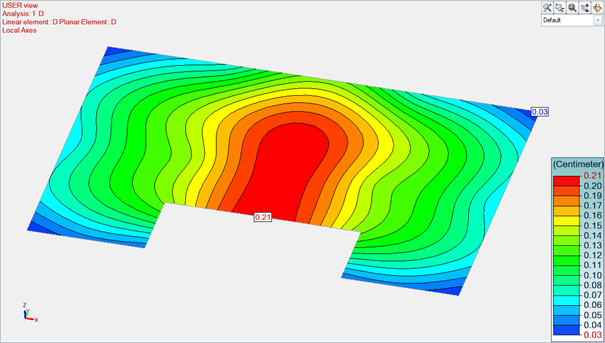
Let’s now take a look at the display modes available. The default one is called ‘Deformed’ which presents the results as color maps on the deformed structure. This mode is available also to linear elements, which allows showing results for a whole structure using common color scale.

There is a twin mode, called ‘Iso regions’, which also shows the results as maps but only for surface elements. The iso-value regions represent colored polygons on the planar elements corresponding to certain results on displacements, forces, stresses. Thus it is possible to view the highest stress areas on the planar element within a single glance. The values of these regions can be smoothed or not; for this purpose you can use the option “Smooth results on planar elements” from the Results dialog box – Options tab.

The next display mode is called ‘Iso lines’. The color of iso lines correspond to the results color scale. Note that regardless of the selected style, additional presentation options can be set, such as visibility of the finite element mesh, display of extreme values or values corresponding to particular iso lines.

The next display mode is called ‘Iso maps’, which combines the display of isolines and solid color maps.
As mentioned earlier, we can control additional graphical settings. In the example below, we have the same display mode but with isolines turned off and values displayed in finite element centers.

The next two similar display modes are called ‘X Diagram’ and ‘Y Diagram’. These are diagrams in the X or Y direction of the local system respectively, displayed in a plane perpendicular to the surface element. As these diagrams pass through the centers of the finite elements the resulting effect depends on the density and shape of the mesh.

The next display mode available is called ‘Values’. And as the name suggests, it displays values in finite element centers. Depending on the settings the values can be displayed in scale colors or in solid color.

As the values can be difficult to read (too small or overlapping) in the case of a dense or irregular finite element mesh or at lower magnification, we can display the values using another style called ‘Values on grid’. This display mode comes in three variations – for presenting minimum, maximum or average values in a grid. The results grid is a virtual mesh of regularly arranged rectangles used only for the presentation of results. The setting of the mesh size is available individually in the properties of each surface element.

Additional settings
In addition to the presentation display modes, Advance Design offers various additional options for setting the presentation of the results. Firstly, we can control the color scale. For example, we can set a reduced number of ranges with defined limit values.

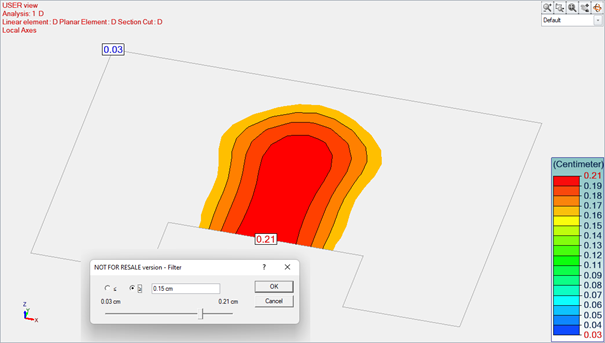
Another possibility is the presentation of results using Dynamic Contouring command. This allows you to filter the displayed values to a selected range.
Another way of presenting results for surface elements is to display intersection diagrams. These are created using linear Section cut objects. You may create section cuts in the modeling step and in the analysis step, and like all elements of the model, the section cuts may be selected, resized, moved using CAD tools. Diagrams on section cuts may be generated in the element plane or in a perpendicular plane.

Finally, it is still worth mentioning that for planar elements it is possible to view the forces and stresses results expressed in the main axes. For this we use dedicated display mode called ‘Main axes’. The two main axes are represented graphically by their color, the sign is represented graphically by the arrowhead direction (inward for negative values and outward for positive values) while the angle of axis orientation is given by the alpha values.

Learn more about Advance Design!
Visit website – https://graitec.com/advance-design/
Visit Advance Design Virtual Stand – https://graitec.com/advance-design-virtual/
Linkedin – https://www.linkedin.com/showcase/advance-design-&-advance-design-connection/
Free trial – https://graitec.com/free-trial/
